Advancing Thermal Assessment in Engineering: 3D Visualization and Analysis
THERMOGRAPHYTHERMAL IMAGINGENERGY EFFICIENCY INNOVATION
Introduction
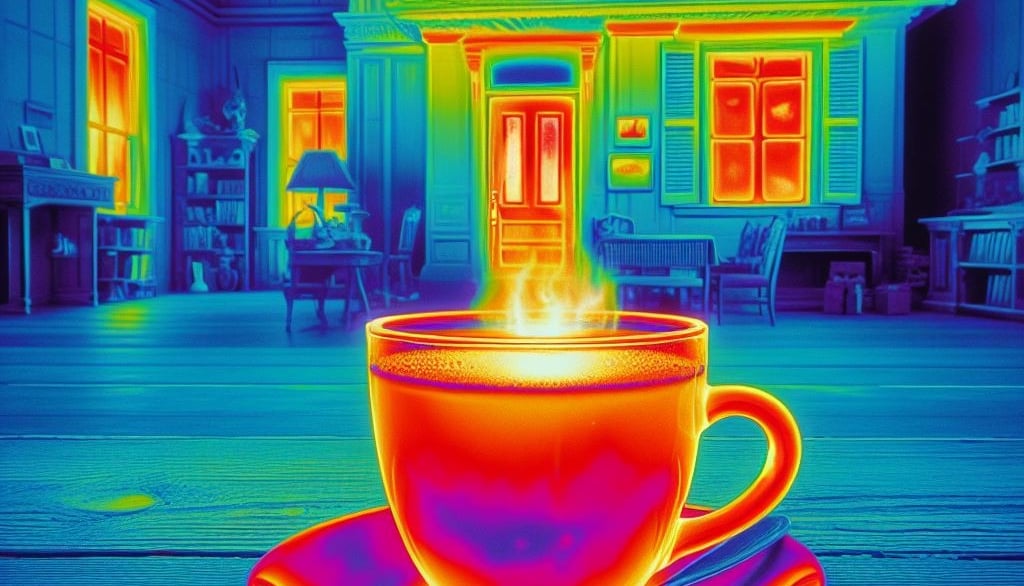
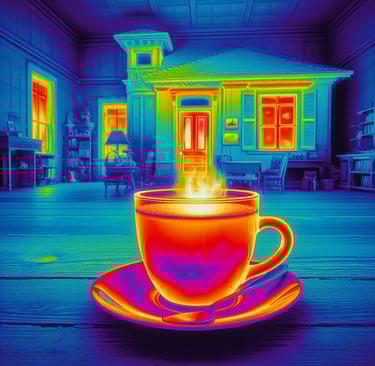
Thermography is the study of heat distributions of an object using an infrared camera. It has a wide range of applications across various sectors. One of the most recent applications was during the Covid 19 pandemic when airports installed IR cameras to detect the temperature of travelling passengers and know whether or not the passenger had a fever. During my thesis, we used thermography to create thermographic maps of an urban environment.
In the topic of today, we come across the field of construction where thermography was used innovatively along with GIS and 3D point cloud processing software to visualize and analyze 3D thermal data. The study published by Anton et al in 2021 studies how this combination of technology was used to study the thermal bridges at the intersection between pillars and slabs of buildings in Andalusia, Spain. They conducted two surveys in two different areas in the region at two different seasons.
The Importance of Thermal Assessment
Thermal Assessment involves evaluating the thermal performance of buildings, identifying areas of heat loss or gain, and optimizing energy efficiency. By understanding how heat is distributed within a structure, engineers can make informed decisions regarding insulation, ventilation, and heating systems. This plays an important role when you want to ensure your building saves up on heating or cooling costs across its lifetime. This is both an environmental and an economical decision.
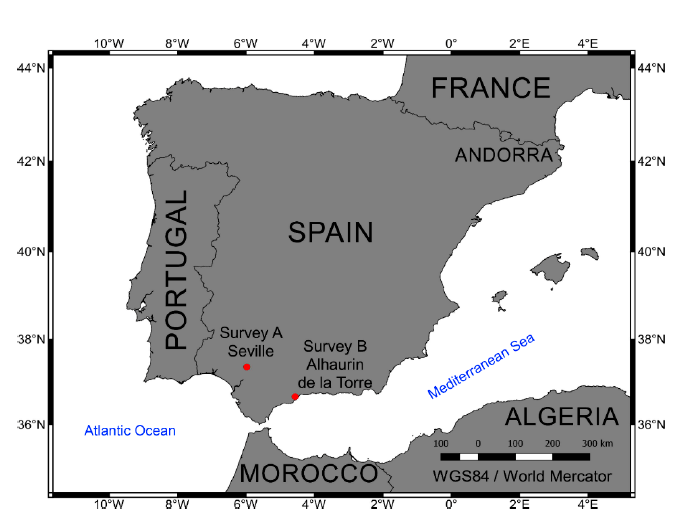
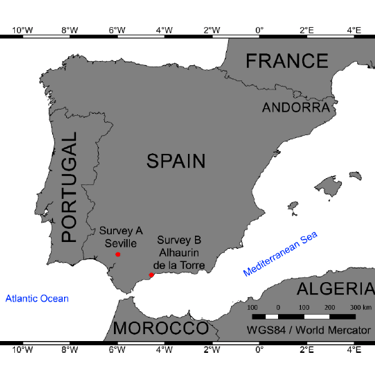
Surveys A & B Locations (Anton et al. , 2021)
The Advantages of 3D Visualization
With the integration of 3D visualization and analysis, engineers can now gain a comprehensive understanding of thermal behaviour in a building. The approach starts by capturing thermal images of the building using an infrared camera and then constructing a 3D model of the site with cloud processing software such as Agisoft Metashape. This 3D model is then loaded into a GIS software which creates a proper visualization of the model’s heat distribution.
By visualizing the data in three dimensions, it becomes easier to pinpoint areas of concern and assess their impact on the overall thermal performance of the building. That way the engineers and analysts can properly visualize the thermal anomalies and focus on which areas to improve.
Moreover, 3D visualization enables engineers to visualize the temporal dynamics of thermal behaviour. By capturing thermal data over time, engineers can analyze how heat distribution changes throughout the day or over different seasons. This information is invaluable for optimizing energy usage and identifying potential issues with insulation or ventilation systems.
Integration with Geographic Information Systems
One of the key advancements in thermal assessment is the integration of 3D visualization with Geographic Information Systems (GIS). GIS provides a powerful platform for spatial analysis and data visualization, making it an ideal tool for analyzing thermal behaviour in buildings.
By overlaying the 3D thermal data onto a GIS platform, the relationship between thermal behaviour and other spatial factors such as building orientation, surrounding land use, and solar radiation can be visualized. This integration allows for a more comprehensive understanding of the factors influencing thermal performance and creates data-driven decisions regarding building design and energy management.
Main Scope of the Study: Heat Bridges Identified
The study posted by the authors focuses on the heat bridges formed between the reinforced concrete columns of the structure and the slabs. The research was conducted in the region of Andalusia in Spain.
The main key points were:
As a primary focus, the heat bridge between the two structural elements was studied due to the lack of insulation.
The authors used infrared technology to capture the thermal behaviour and heat transfer patterns of the elements amongst one another.
Special attention was given to what these heat patterns pose for the structural integrity as well as energy inefficiencies of the buildings.
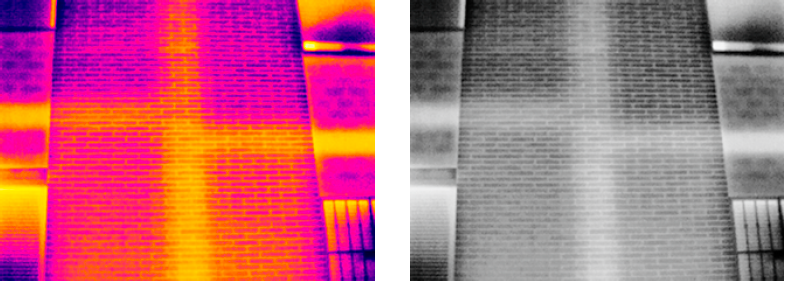
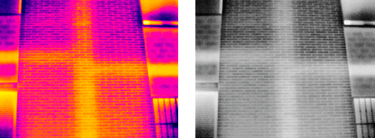
Surveys A facade (Anton et al. , 2021)
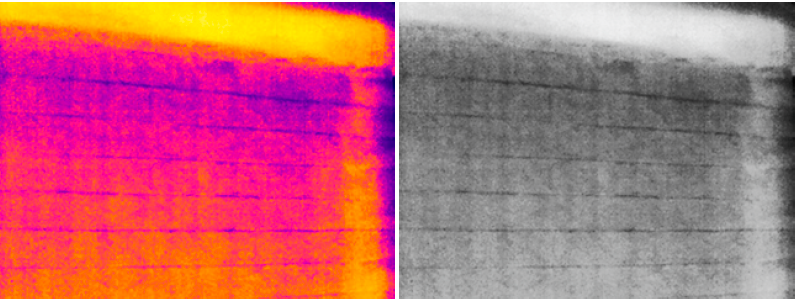
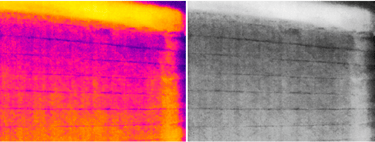
Surveys B facade (Anton et al. , 2021)
Results
After conducting this integration, the authors found the following results:
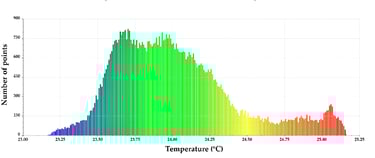
The surveys revealed how different a symmetrical vs a non-symmetrical facade behaves thermally. Survey A revealed a lower temperature with a higher standard deviation (temperature is more spread). Survey B revealed a higher overall temperature but a lower standard deviation.
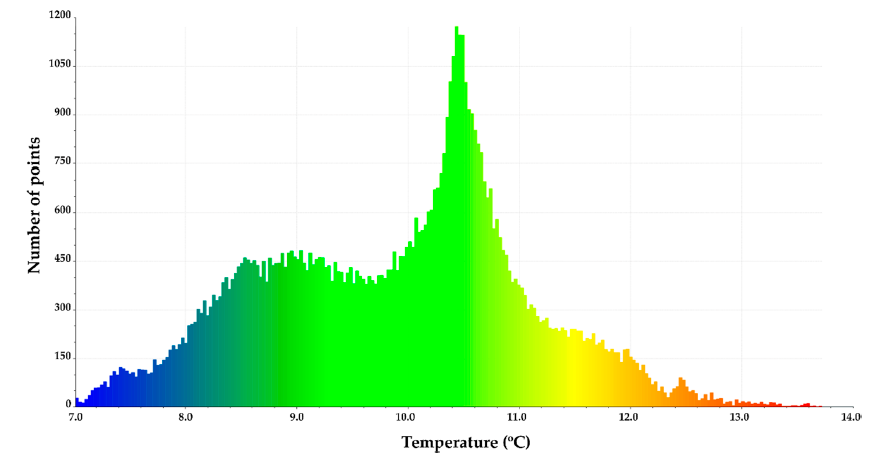


Surveys A Temperature Histogram (Anton et al. , 2021)
Surveys B Temperature Histogram(Anton et al. , 2021)
The approach combining infrared radiation technology, GIS and 3D point cloud software created a comprehensive analysis and visualization of the different building elements according to their materials and seasonality.
The specific case studies conducted in Andalusia, Spain, demonstrate the effectiveness of the approach in capturing and analyzing the thermal behaviour of building components.
Combining the three elements of IRT, GIS and 3D point cloud creates a path of a cost-effective road for energy audits, restoration, and product quality control, contributing to sustainable engineering practices.
Conclusion
The advancement of thermal assessment through 3D visualization and analysis presents a significant opportunity for the engineering and construction industry. By leveraging this innovative approach, engineers and researchers can gain deeper insights into the thermal performance of buildings, leading to improved energy efficiency, maintenance strategies, and overall sustainability. As the study continues to unfold, it holds the potential to revolutionize the way thermal assessment is conducted in the engineering domain.
This study's findings offer a glimpse into the future of what can be possible by combining infrared technology with GIS and 3d point cloud software. By providing cost-effective and accessible means for energy audits, restoration, and product quality control, this approach contributes to sustainable engineering practices. As such, it is a promising development for the field of engineering graphics and thermal assessment.
Using these innovations, we take another step into using innovative ways to aid in making data-driven decisions that align with reducing costs and improving sustainability.
Subscribe to our newsletter